Formatting Data Sources in Tableau Desktop
Introduction
An important step in creating visualizations in Tableau is ensuring your data is properly formatted. Regardless of the data you are working with, no one wants to manually adjust fields like "Sales" to currency every time they connect to a data source. In this blog post, we’ll cover essential tips for formatting Tableau data sources before publishing them to Tableau Server or Tableau Cloud. By doing so, you ensure consistency and make it easier for others to use the data, saving time and reducing errors.
Ways to Format
Prior to publishing a data source to Tableau Server or Tableau cloud there are a few things you can format. By formatting the data source you can ensure that if you or anyone else uses the published data source there will be consistency when using fields in dashboards. The five we will focus on are: adding definitions, calculated fields, groups and sets, default formatting and dimensions and hierarchies
Adding Definitions
Adding field definitions to a data source enhances clarity for analysts and end users by providing clear insights into what each field represents, how it is defined, and the calculations involved. This process helps mitigate errors and confusion when users interact with the data.
How To Add Definitions:
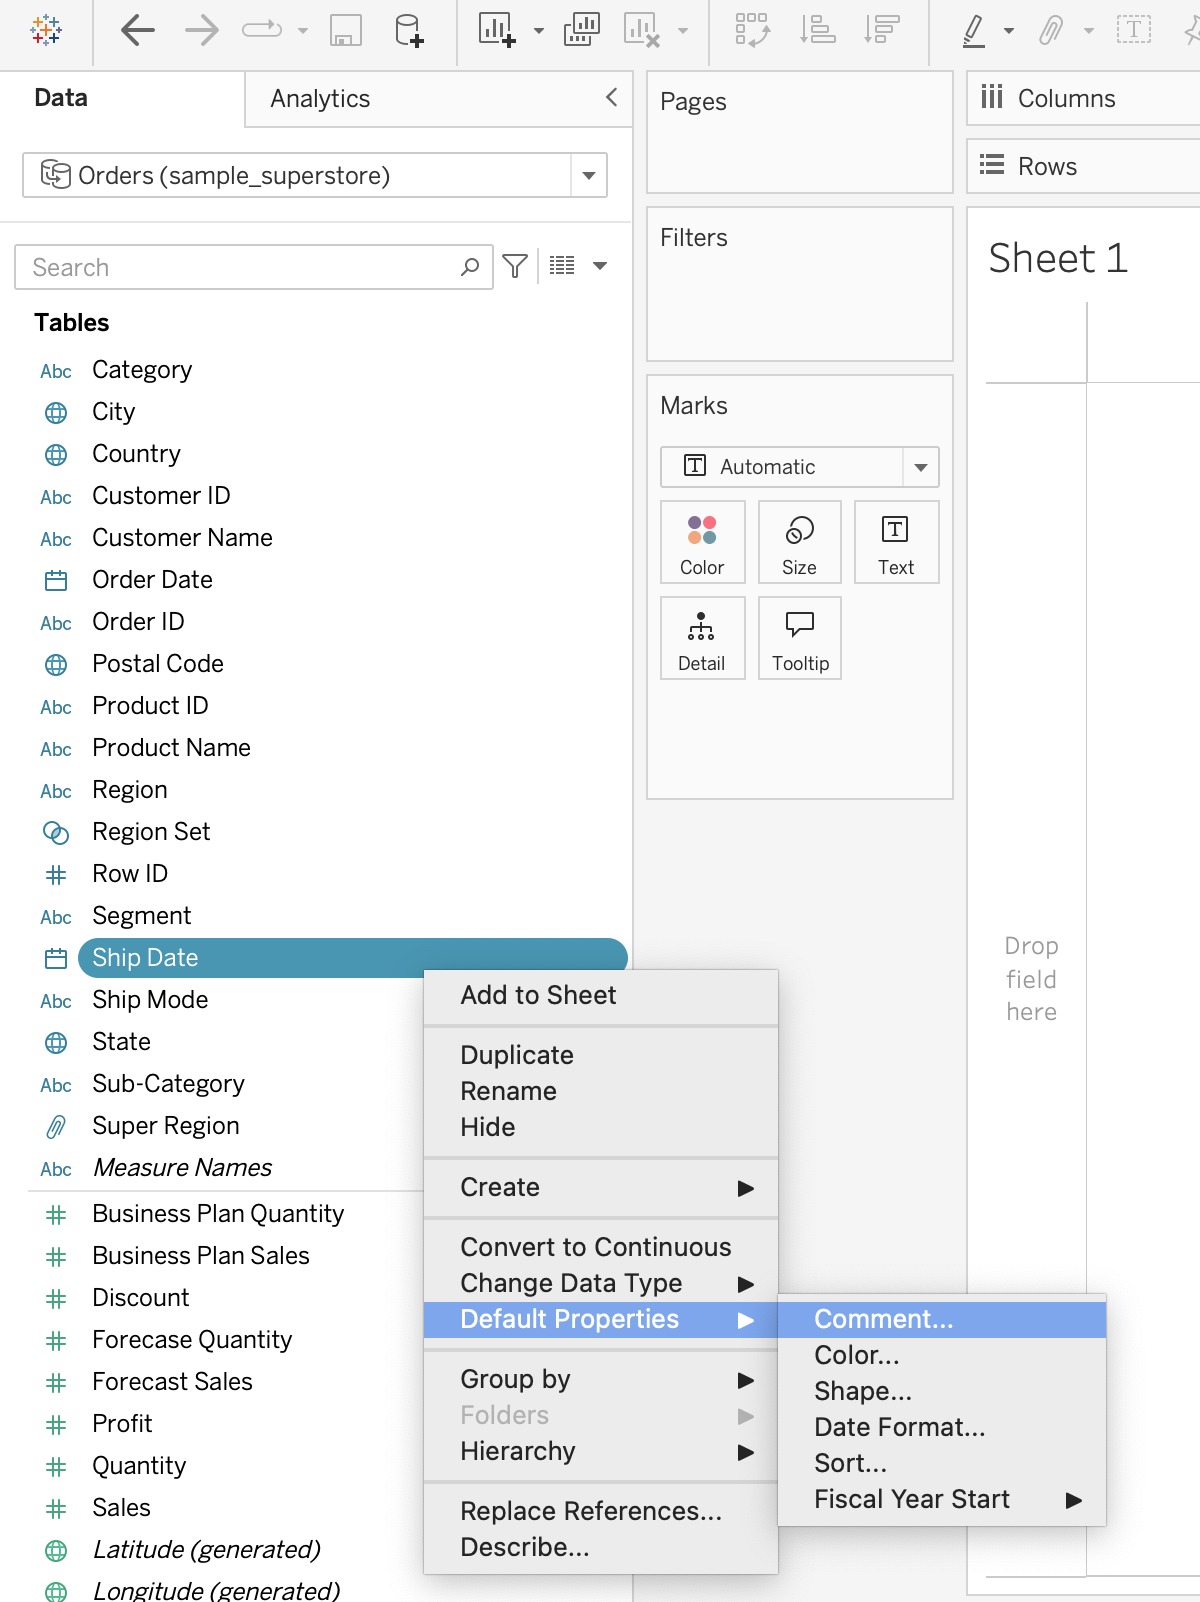
Begin by right-clicking on any desired dimension.
Select Default Properties.
Click on Comment.
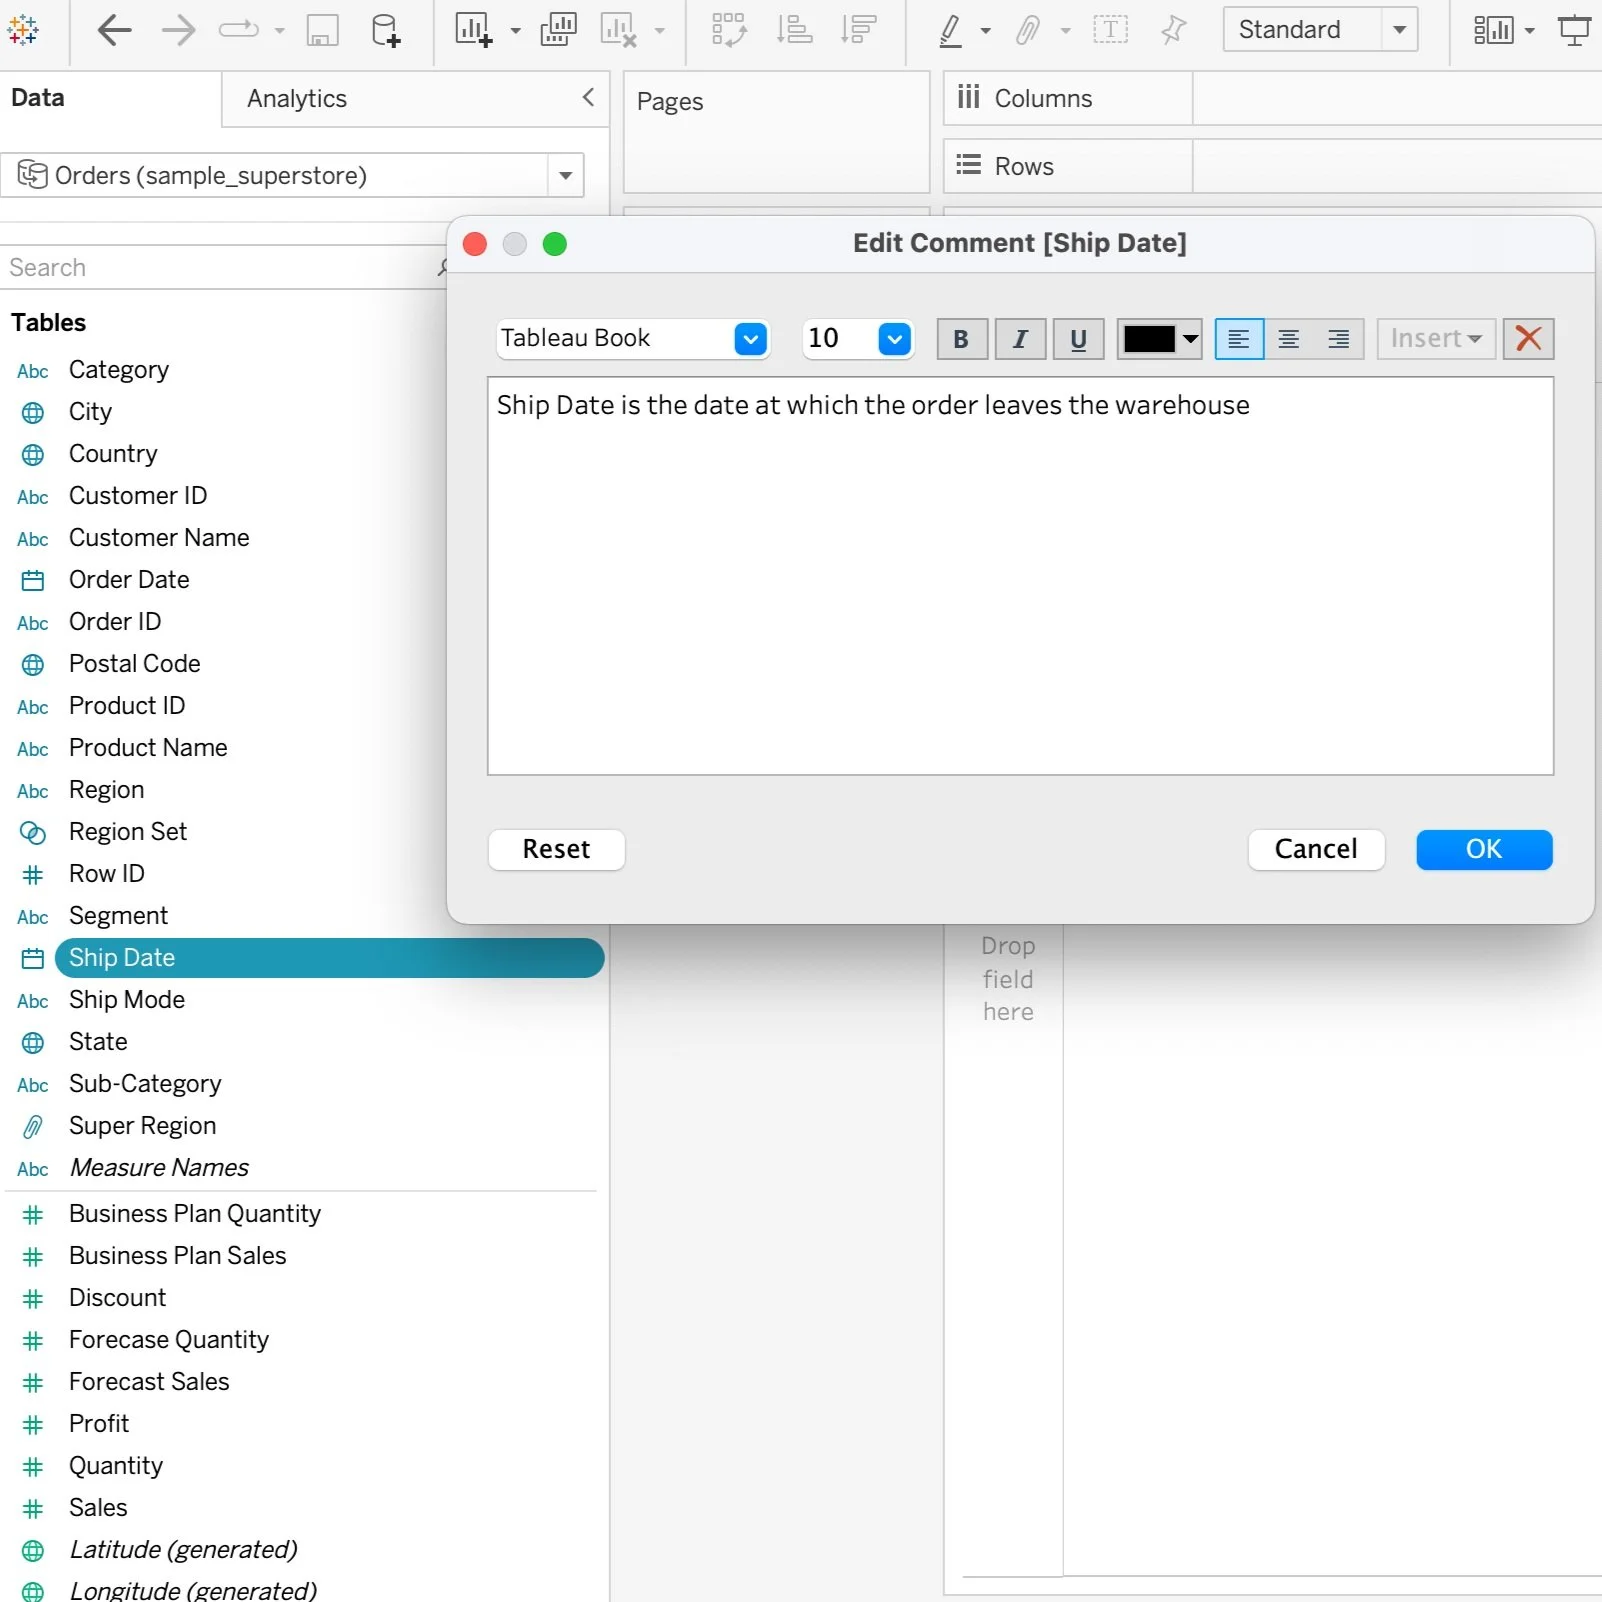
Type in the definition of the field and click OK.
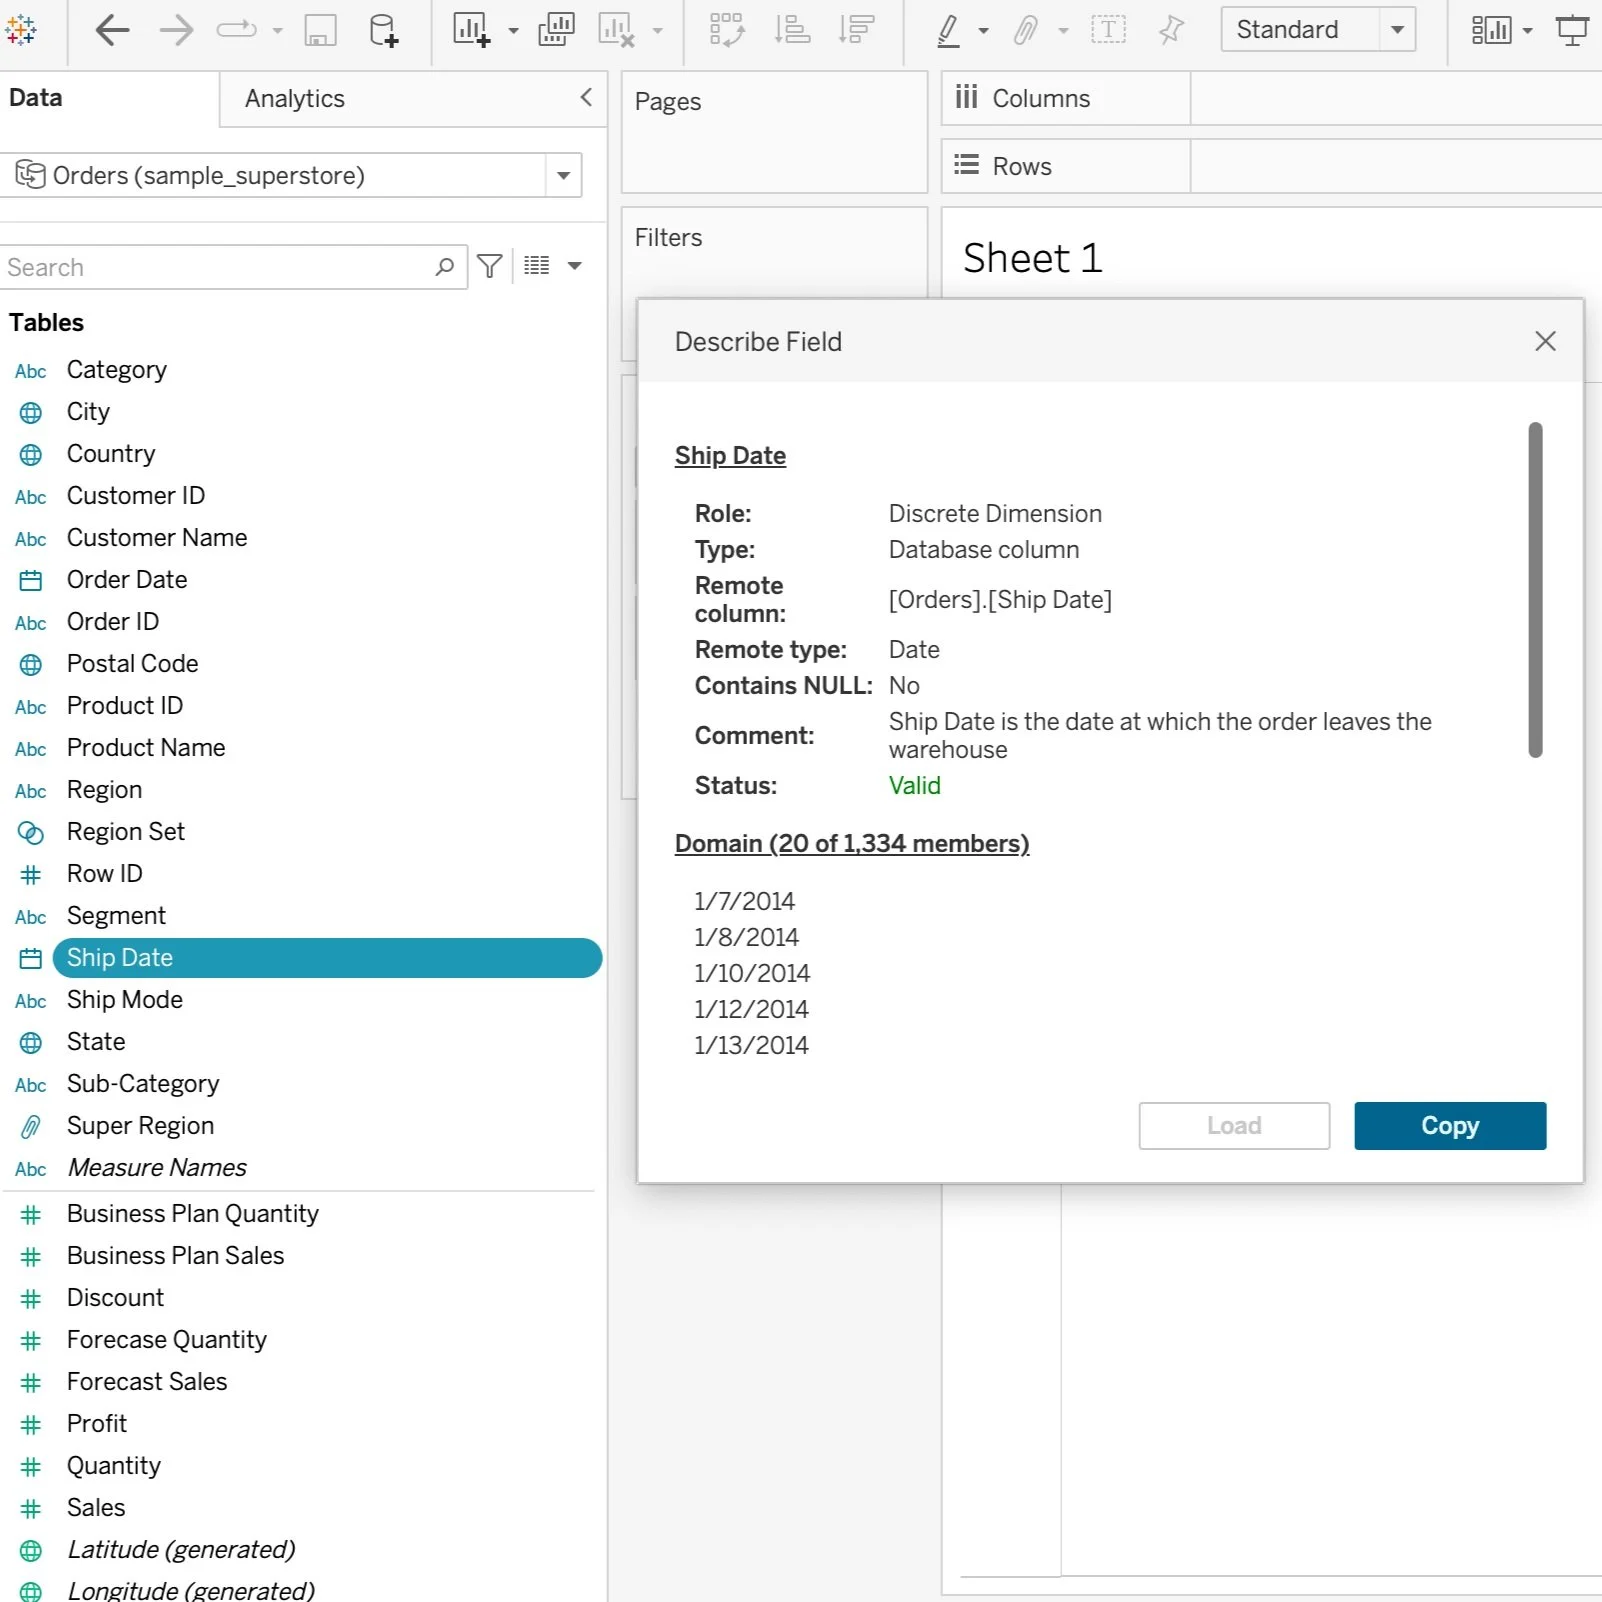
Reviewing the Definition:
Right-click on the field again and choose Describe. The definition will be visible in the Comment section.
Note: This functionality is exclusively available in the Desktop version. While it can be implemented on the server as well, this option necessitates an additional license and incurs costs associated with Licenses Data Management.
Calculated Fields
You can create calculated measures and dimensions and publish them with the data source, which eliminates the need to create a new field every time. This functionality is particularly beneficial for frequently used fields such as Net Sales or percentage rates that are not pre-calculated in the underlying data source.
How To Create Calculated Fields
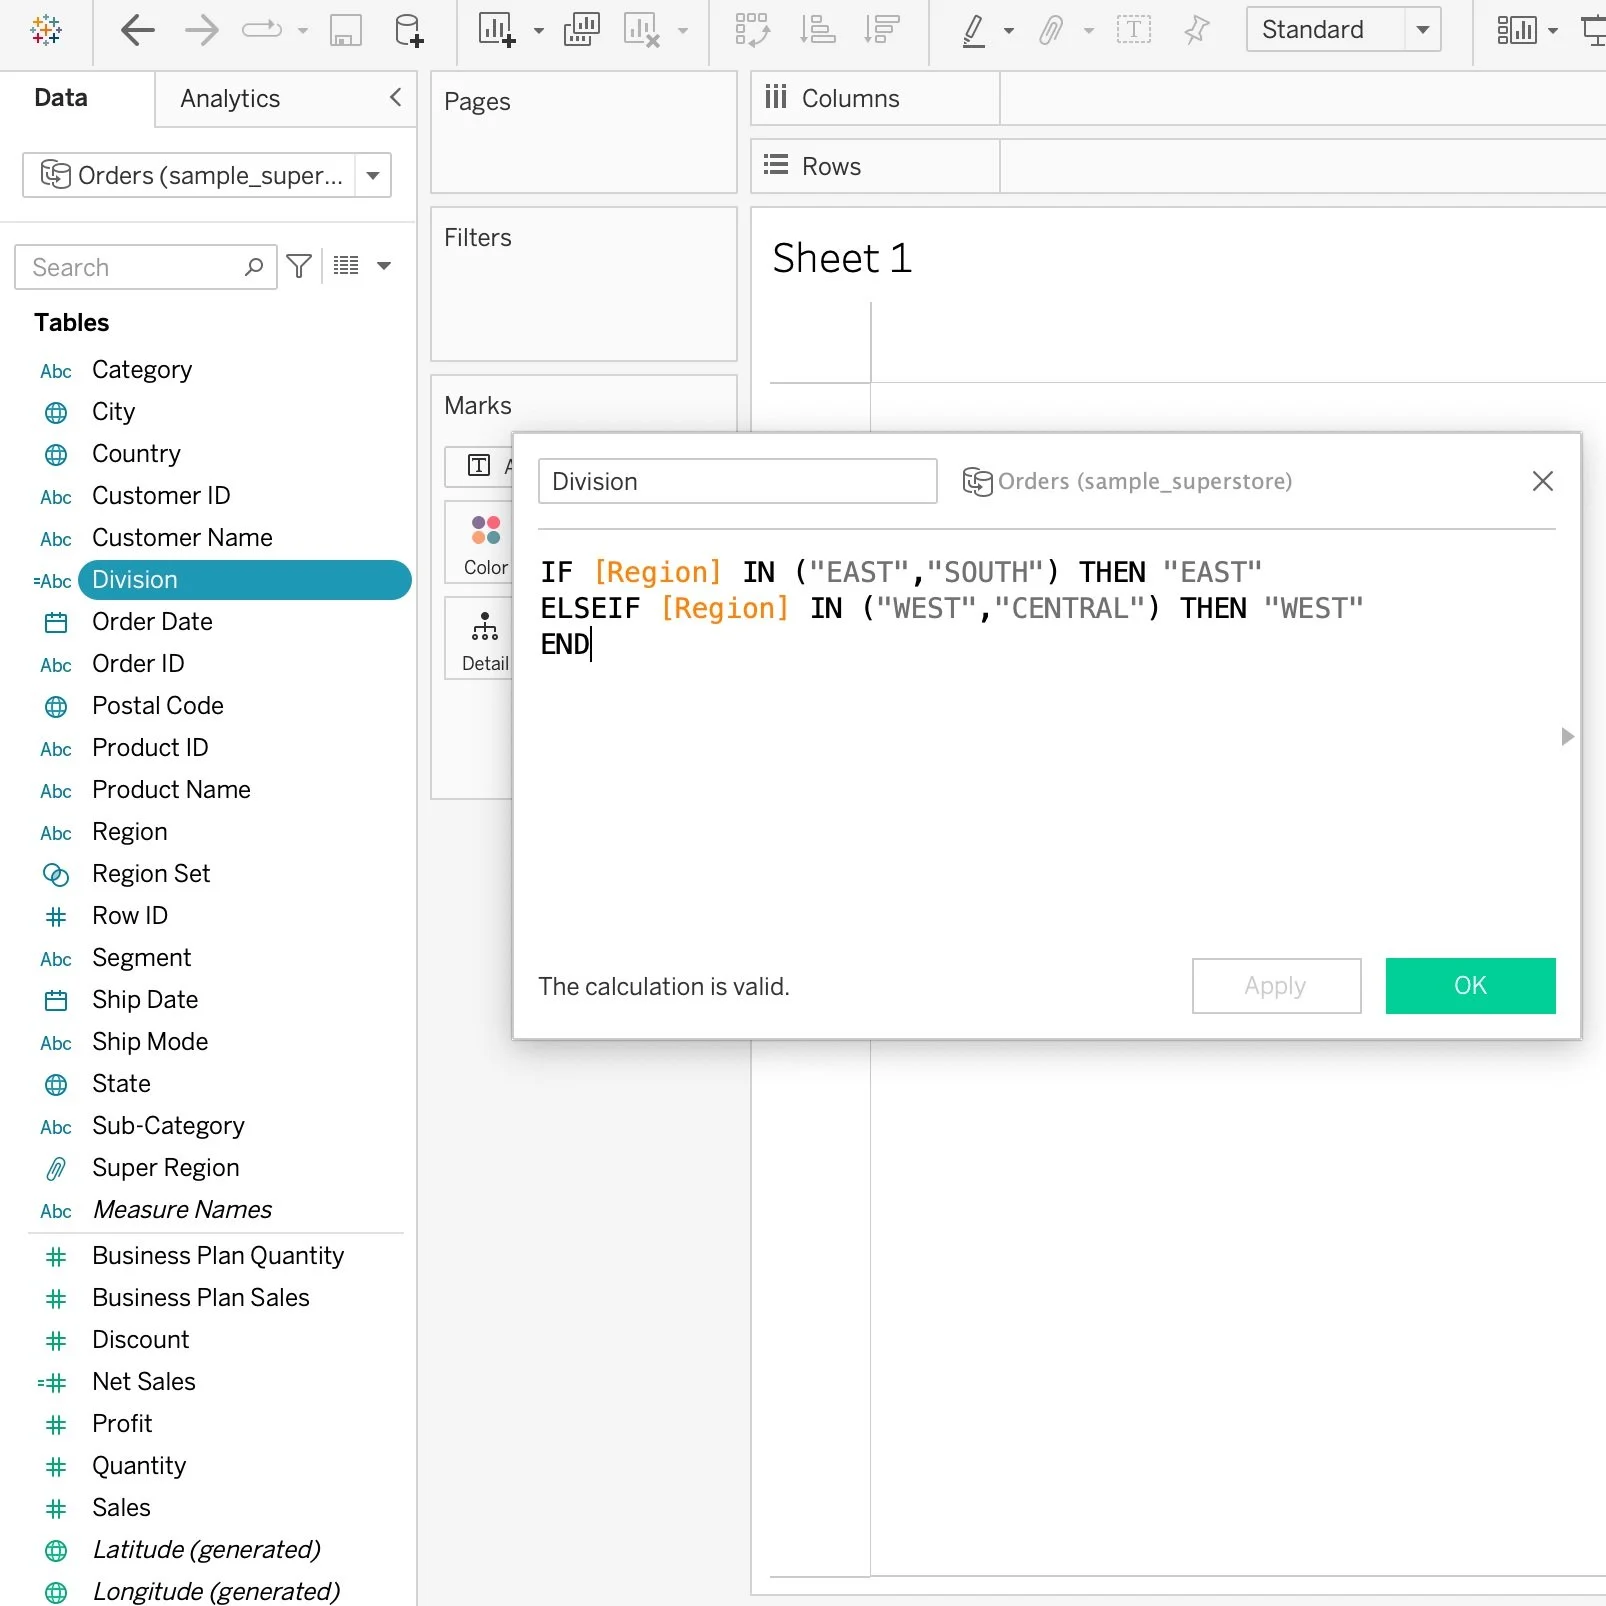
Create a calculated field: Select the measures and/or dimensions you wish to use for your calculation.
Click OK: This action will make the newly created field available in the data source.
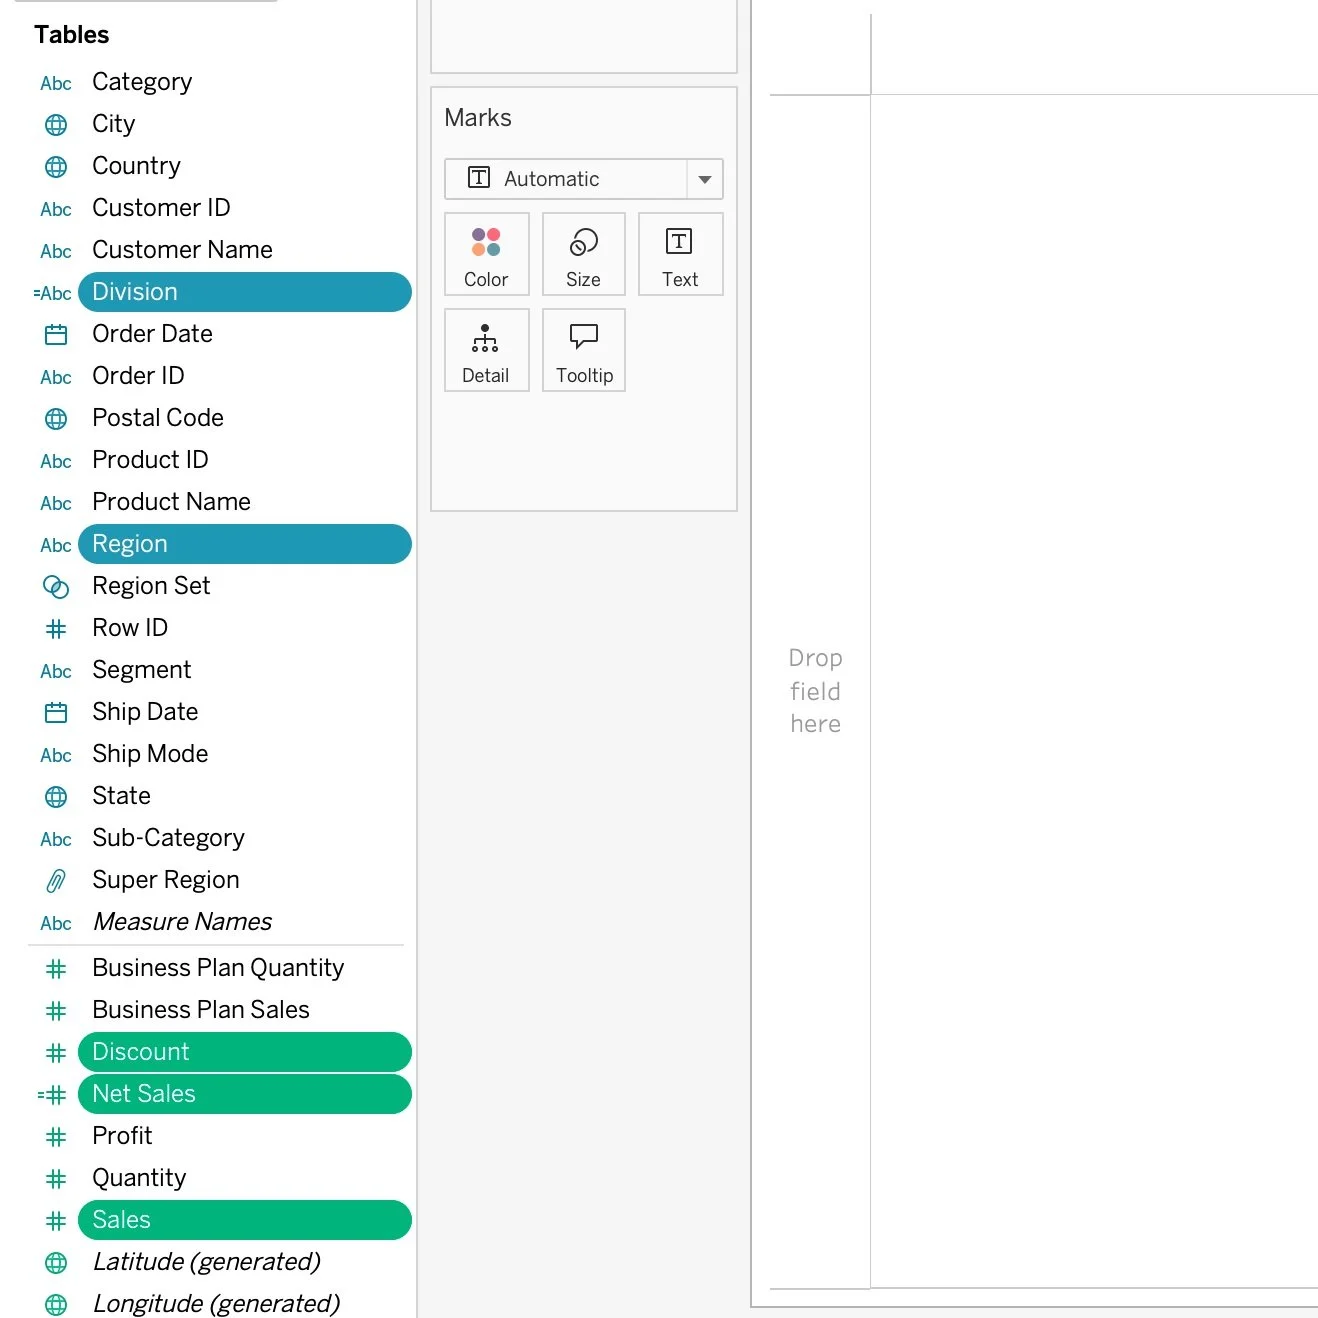
In the data source, you can easily distinguish between native measures or dimensions and calculated fields based on their display format. Any calculation will have an equal sign (=) preceding the field name, indicating the data type. For example, you will see =Net Sales versus Sales or =Region versus Region.

Formatting for Measures and Dimensions
You can set default formatting for various field types to ensure consistency when users are accessing the data source to build reports. This way, every time you open the report, you do not have to reformat your commonly used fields.
How To Format Measures and Dimensions:
Begin by right-clicking on any desired measure or dimension and select Default Properties.
Select an option below to format
Number: This can be used for numbers, currency, scientific values, and percentages.
Date: You can adjust the date to show various formats or remove timestamps.
Geographical: Set a field to have a geographical role, such as City, State, or County.
Color/Shape: If you use standard colors or shapes to depict a dimension, you can preset the field to display the specific colors when using the dimension in Tableau. For example, use branded colors for specific regions or shapes for given indicators.
By applying these formatting options, you enhance the clarity and consistency of your reports, making data interpretation more effective for all users.


Creating Hierarchies
Hierarchies can be established to enhance reporting capabilities by enabling deeper drill-downs into data. Each drill-down option must be configured as its own dimension.
How To Create Hierarchies:
Begin by right-clicking on any desired dimension.
Select Hierarchy:
Create Hierarchy: Establish a new hierarchy from scratch.
Add to Hierarchy: Incorporate the field into an existing hierarchy.
Arrange Fields: Once created, you can arrange the fields in the desired order, typically from largest to smallest.
Utilization in Reports: The newly configured fields can then be employed in generating reports. A plus (+) or minus (-) indicator next to the dimension signifies the ability to expand or collapse the hierarchy information.
This hierarchical functionality is inherently integrated into date fields, allowing for efficient data analysis. The plus (+) or minus (-) next to the dimension shows you can either expand or contact the hierarchy information.


Creating Groups and Sets
Groups and sets in Tableau function similarly to calculated fields but offer a more straightforward way to organize dimensional data.
How To Create Groups and Sets:
Begin by right-clicking on any desired dimension.
Select "Create Group" or "Create Set."
Configure your group or set for reporting.
Click OK: This action will make the newly created Group or Set available in the data source.
Note: When blending with other published data sources, be aware that Tableau does not permit building relationships based on groups or sets. However, relationships can be established using calculated fields.


Conclusion
These valuable formatting tips will help to significantly streamline the process of dashboard building, effectively reduce the potential for human error, optimize and streamline calculations, and ultimately lead to the creation of more effective and consistent visualizations.